Each shipment is a key element of overall operational success, and having a clear understanding of how KPIs are calculated is essential for optimizing performance. That’s why we’ve prepared this guide to explain exactly how we track the key performance indicators, helping you get the most out of your shipments.
Summary:
1. Main KPIs
- Processed Shipmengs
- Average Shipping Cost
- First Delivery Attempt
- Transit Time
2. Performances KPIs
- Early Shipments
- On-time Shipments
- Late Shipments
- Shipments with Exceptions
- Shipments
- Geo distribution
- Exceptions
1. Main KPIs

Processed Shipments
Number of shipments that have been processed and shipped. We consider shipments “processed” if they were picked up by the Carrier and received the ‘In Transit’ status from the Carrier in the selected time period. We exclude all orders that were not actually shipped.
Average Shipping Cost
Estimated average shipping cost calculated on shipments that received the In Transit status from the Carrier. This is a weighted average that excludes shipments with missing cost data.
Please note that it’s the estimated shipping cost and not the actual cost billed by the Carrier.
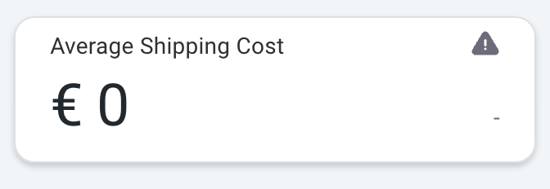
If you see the Shipping Cost equal to 0, you can enable it depending on how you generate labels:
-
You generate labels via API - We retrieve the cost from the ShipmentCost parameter in the Ship API. You can use our GetRates API before of Ship call in order to choose the best carrier's rate option for your shipment
-
You generate labels via Platform - You can upload the Carrier price lists into ShippyPro. Discover how to set Carrier rates
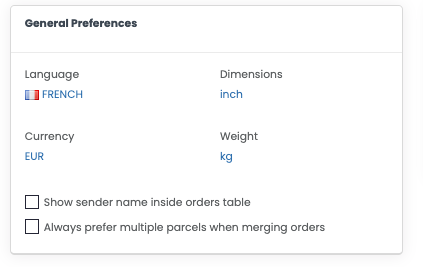
It is converted into your profile currency using the exchange rates at the time of the label creation. If you need to change your profile currency, go to General Preferences
First Delivery Attempt
Average time from the 'In transit' status from the Carrier to the first delivery attempt, excluding Saturdays and Sundays for accurate transit time. FirstDeliveryAttempt = (DeliveryTime OR FailedAttemptTime) - FirstInTransitTime
We’ve made a dedicated effort to exclude outlier shipments with evident anomalies in their tracking history, ensuring that the data provided is as reliable and accurate as possible.

Transit time
Average time from the 'In transit' status received from the Carrier to the successful delivery, excluding Saturdays and Sundays for accurate transit time. TransitTime = DeliveryTime - FirstInTransitTime
We’ve made a dedicated effort to exclude outlier shipments with evident anomalies in their tracking history, ensuring that the data provided is as reliable and accurate as possible.

2. Performance KPIs

There are two types of Performance KPIs:
-
Early, On-time and Late shipments: they represents the performances by focusing on Transit time
-
Shipment with Exceptions: they represents the performances by focusing on Exceptions
If your dashboard shows no value, you can configure your transit days by Area or Country in the Optimizer settings
Early Shipments
Percentage of shipments that were delivered in advance of the target transit days configured in the Optimizer settings.
On-time Shipments
Percentage of shipments that were delivered in time according to the target transit days configured in the Optimizer settings.
Late Shipments
Percentage of shipments that were delivered later than the target transit days configured in the Optimizer settings.

Shipments with Exception
Percentage of shipments that were processed and received an Exception status from the Carrier at least once in their tracking history.
3. Boards
Shipments
Shipments and Parcels over time - Trend of shipments and parcels processed in the selected time period. It includes only the Processed Shipments and excludes those that have not been assigned to the Carrier and actually shipped are excluded.
In the top-right corner, you can choose to display either Shipments or Parcels.
Returns - Trend of return shipments that received at least one tracking status update from the Carrier in the selected time period. If you are using the Return Label in the Box option, remember that it includes unactivated returns labels.
PUDO vs Home delivery shipments - Trend of shipments to PUDO (Pickup-Dropoff Points) and Home Delivery in the selected time period. It includes only the Processed Shipments and excludes those that have not been assigned to the Carrier and actually shipped are excluded.
Geo distribution
Delivery performances and costs by Destination - The map visually represents global delivery performance. Each indicator shows the average transit time in days and the estimated average shipping cost.
In the top-right corner, you can choose to display either Transit time or Average Shipment cost.
Performances by Country and City - The table shows the performances of shipments aggregated by destination or origin. It includes only the Processed Shipments and excludes those that have not been assigned to the Carrier and actually shipped are excluded.
Here you can compare the Shipping Volume, Average transit time, Average Shipping Cost and Exception rate of your destinations or your origins.
In the top-right corner, you can choose to display performances either by Destination or Origin.
Performances by Carrier and Service - The table shows the performances of shipments aggregated by Carrier and Shipping Service. It includes only the Processed Shipments and excludes those that have not been assigned to the Carrier and actually shipped are excluded.
Here you can compare the Shipping Volume, Average transit time, Average Shipping Cost and Exception rate of your Carriers and the Shipping Services.
Exceptions
Shipments with at least an exception over time - The chart compares the shipments with at least an exception and the total shipments over time. It includes only the Processed Shipments and excludes those that have not been assigned to the Carrier and actually shipped are excluded.
Shipments breakdown by Exception reason - The table provides a shipments breakdown based on the Exception reason. It includes the processed shipments that received at least one Exception status from the Carrier.
Now you can easily identify the most common issues your shipments encounter during the tracking history.
Performances by Country and City - The table shows the performances of shipments aggregated by destination or origin. It includes only the Processed Shipments and excludes those that have not been assigned to the Carrier and actually shipped are excluded.
Here you can compare the Shipping Volume and the number of Shipments with Exceptions of your destinations or your origins.
In the top-right corner, you can choose to display performances either by Destination or Origin.
Performances by Carrier and Service - The table shows the performances of shipments aggregated by Carrier and Shipping Service. It includes only the Processed Shipments and excludes those that have not been assigned to the Carrier and actually shipped are excluded.
Here you can spot which are the Carriers and the Shipping Services that perform better.
💡 PRO TIP: Improve your Delivery performances with ShippyPro Notifications! Proactively inform customers about delivery with automated Out for Delivery notifications, ensuring recipients are available to receive shipments. Better communication means fewer failed delivery attempts, lower costs, and improved delivery performance KPIs.
💡 PRO TIP: Optimizer displays estimated costs for planning, but to audit actual carrier charges, use Invoice Analysis. Upload carrier invoices to automatically detect billing discrepancies, unauthorized surcharges, and cost differences between contracted rates and what you were actually billed—helping you control shipping expenses and recover overcharges.