
Access and monitor your business-relevant shipments KPI for 170+ carriers in just one click
With ShippyPro Performance Analytics you can get a 360° overview of your Shipping KPIs and make data–driven decisions with customized reports evaluating performances for 170+ Carriers.
The time of complex and manual excel files is over!
ShippyPro Analytics gives you access to powerful Dashboards and Analysis tools:
🚀 Shipment Performance
Get access and monitor your shipment performances with pre-calculated shipment KPIs, such as time in transit and first delivery attempt. Analyze KPIs per country, Carrier and time-range to spot orders and Carrier issues.
📈 Revenue and Shipment Costs
Get real-time access to shipping costs for all your Carriers without waiting for Carrier invoices and without needing to create complex Excel files. Monitor shipment cost incidence per Carrier and country and how they impact your revenue.
Returns (coming soon)
Get real-time access to the Return Dashboard to be informed about the number and values of incoming return orders. Forecast the return value in your profit and loss report and plan warehouse shifts accessing real returns volume.
Contact a member of our Sales Team to activate them now on your ShippyPro account.
Summary:
1. Performance Dashboard
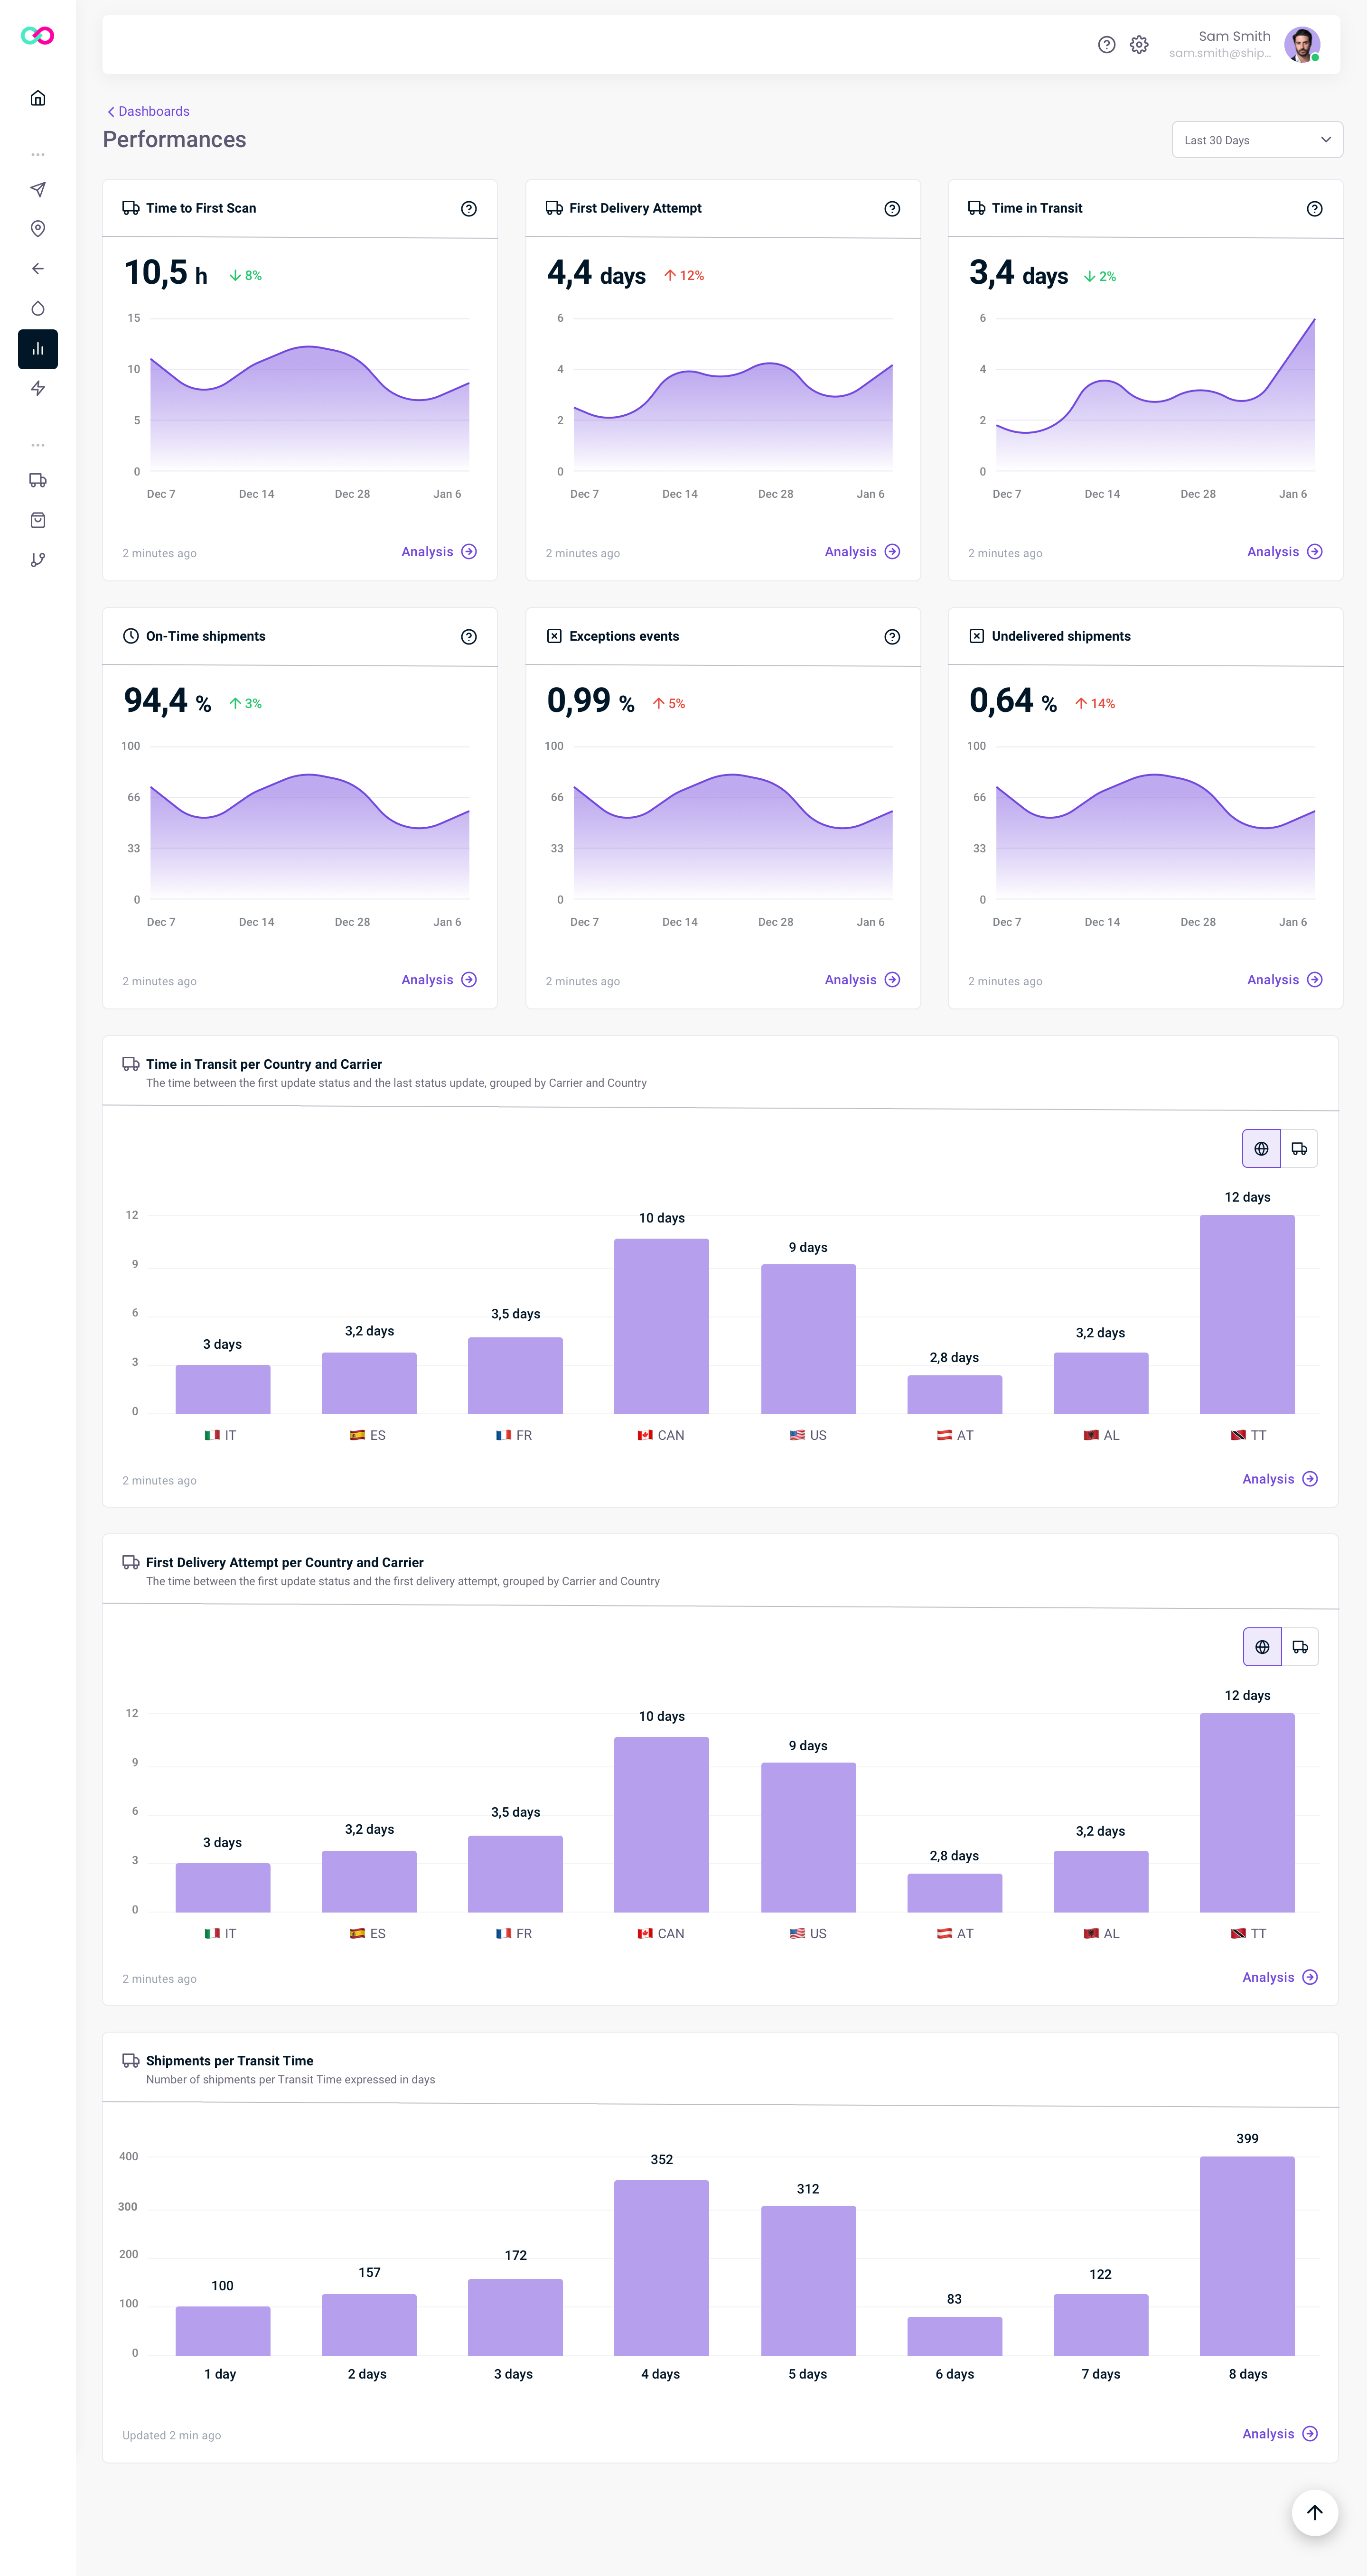
Dashboards are the quickest and easiest way to access and monitor your shipment KPIs. Here you will find a visual representation with KPIs and graphs from the reference period and you can easily view the KPI trend indicator.
On the Dashboard page you can find KPIs related to shipment performance, selecting the time range you prefer:
-
Average Time to First Scan (average time of the first event received by the Carriers)
-
Average First Delivery Attempt
-
Average Time in Transit (the total shipment transit time)
-
% On-Time Shipments
-
% Exception Events
-
% Undelivered Shipments
You can also display the KPIs in a graph that can be switched from Carrier to country and access the visual representation of shipment transit time that shows the number of shipments completed in a given period.
2. Performance Analysis
Analysis is the most powerful tool of the new Analytics section. It allows you to navigate through and consult shipment data.
With analysis, you can access KPIs totals and see single shipment KPIs calculation also expressed in working days.
a. Pre-built grouped analysis views
Grouped Analysis allows you to easily access shipment data and KPIs with predefined groupings and pre-calculated KPI totals.
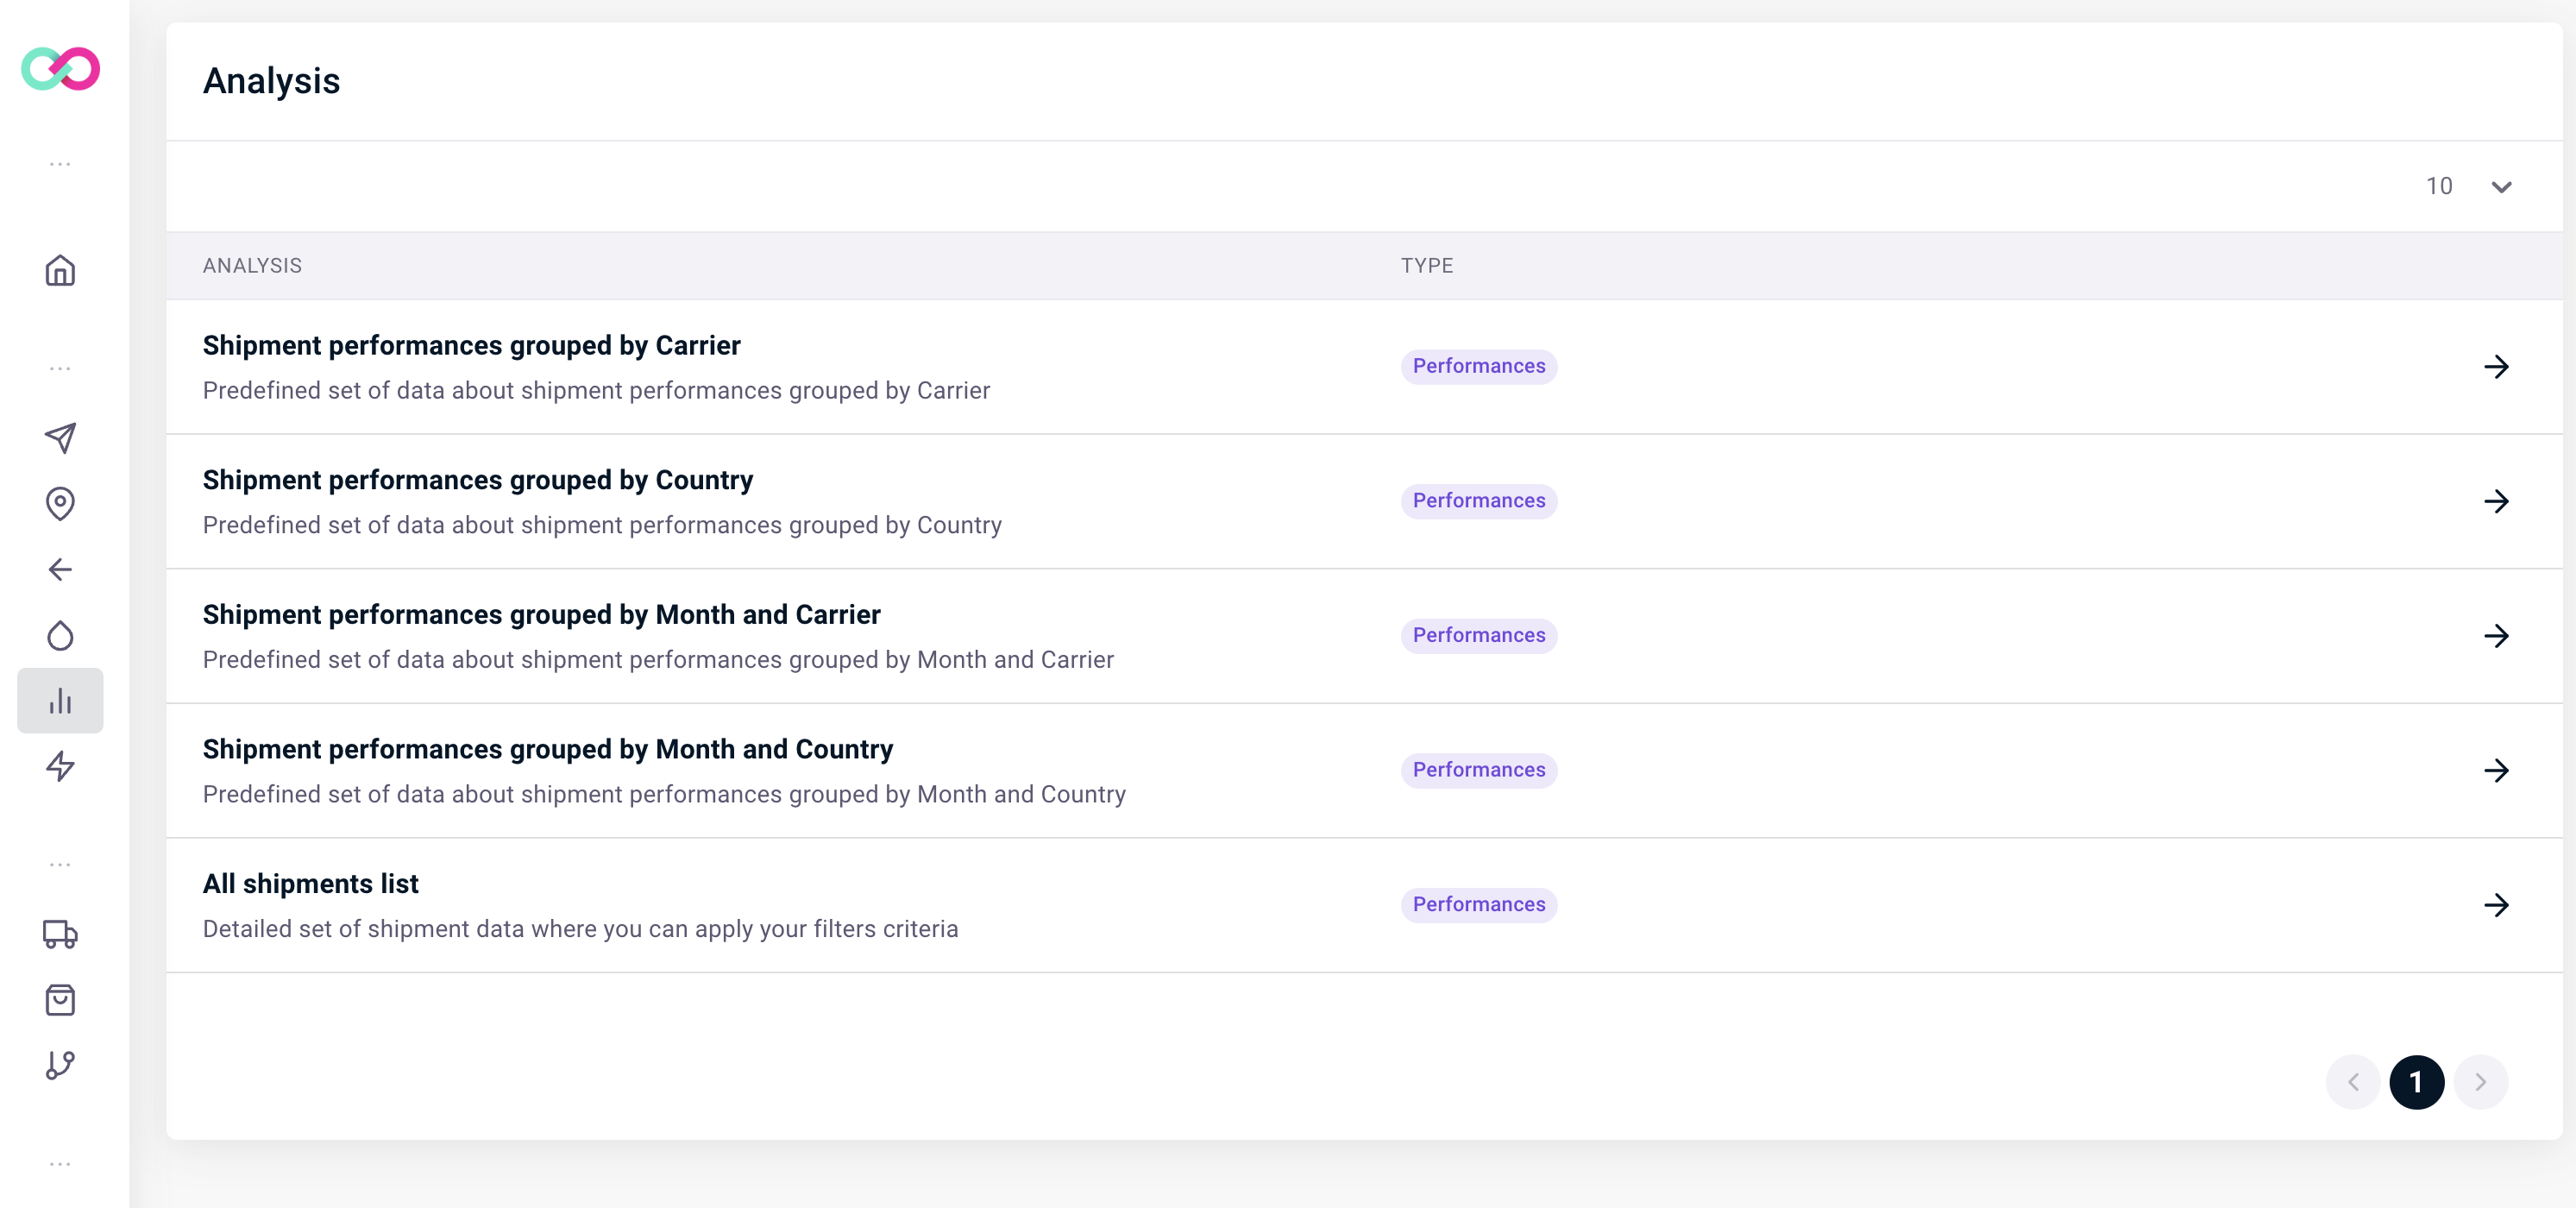
From each analysis you can find grouped and pre-calculated shipment KPIs.
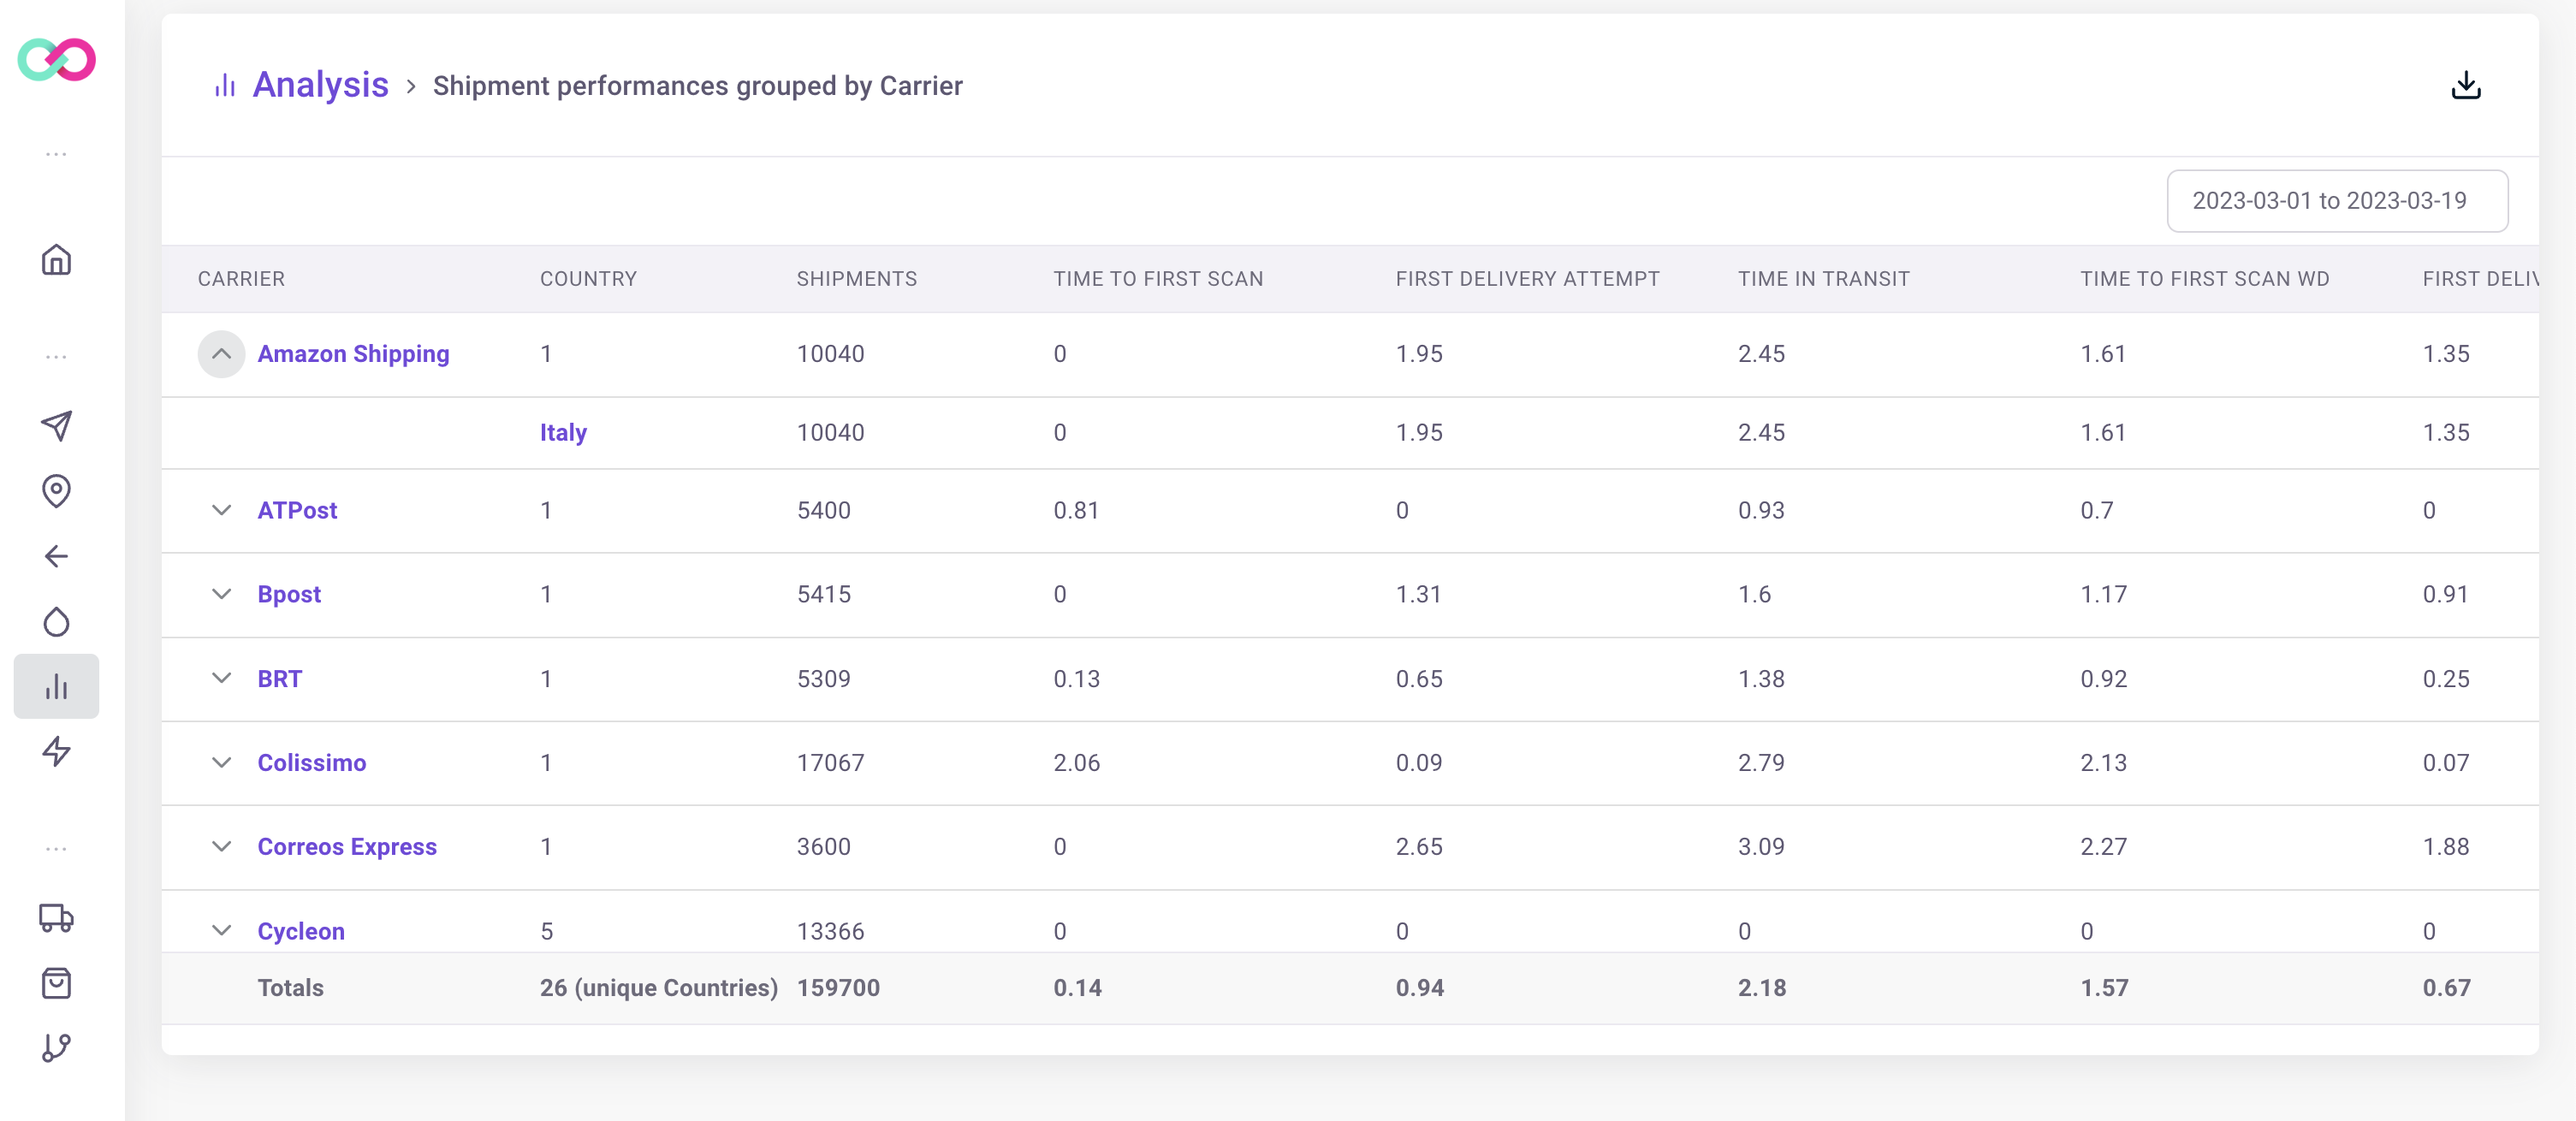
You can expand and see shipments by clicking on each grouping, apply further filters and download all data.
Note: In case you cannot see any KPIs related to the tracking of your shipments (time in transit, operation time, etc.) please make sure that your shipment are properly tracked and, if necessary, check the situation directly with your carrier.
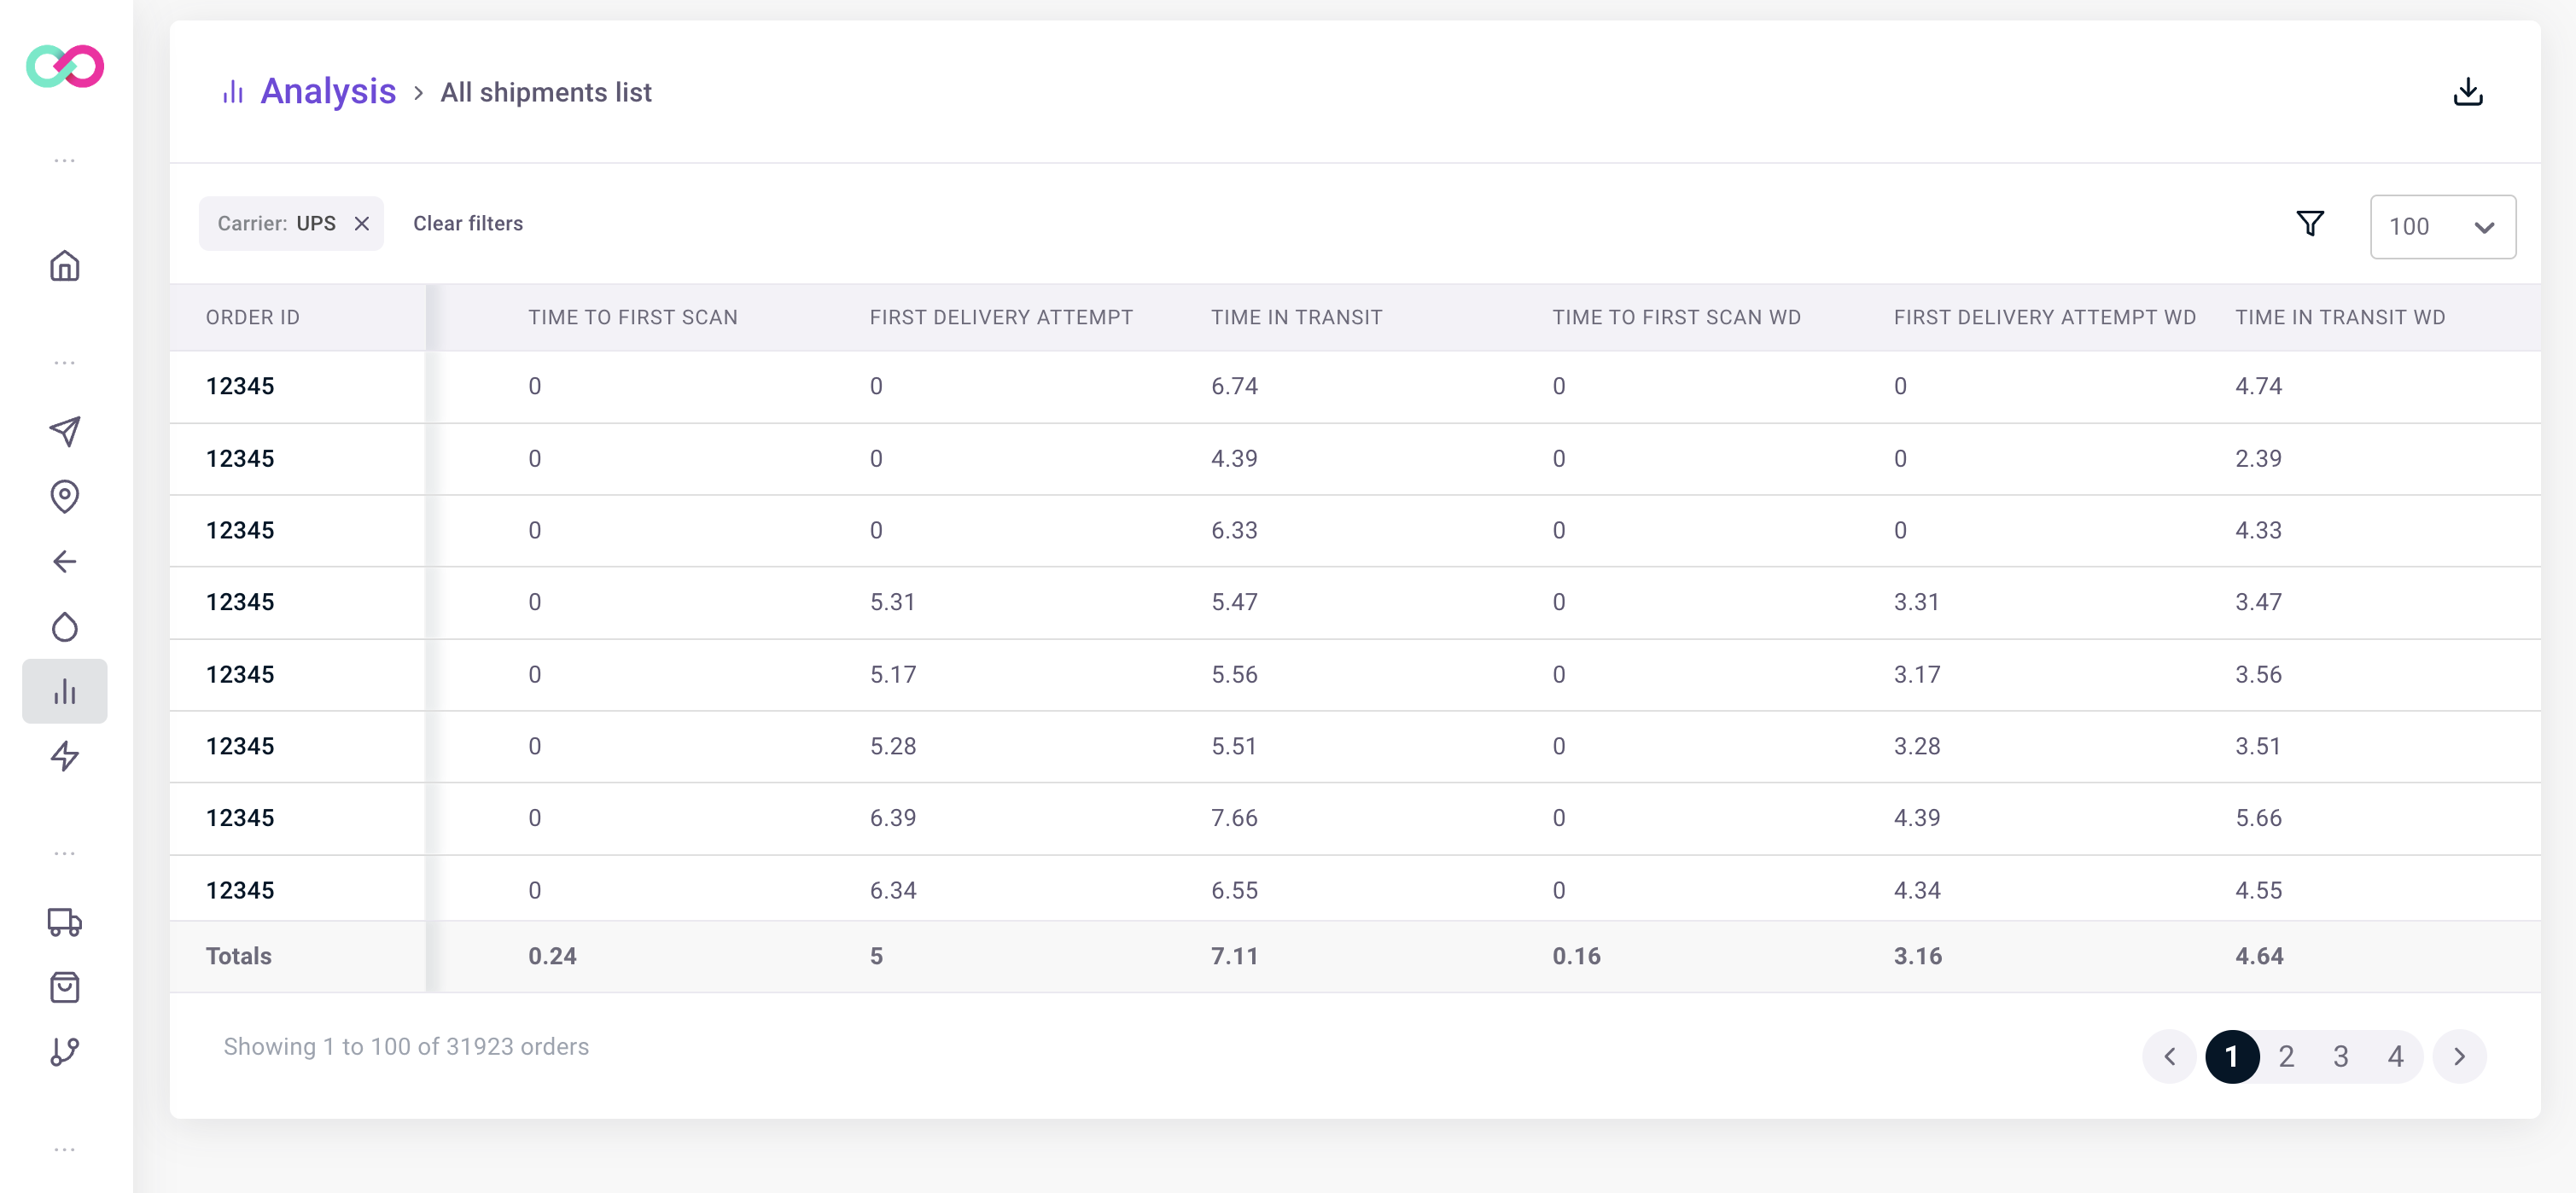
b. All shipments list
All shipments list enables you to access shipment data by applying your filters and getting the related shipment KPIs.
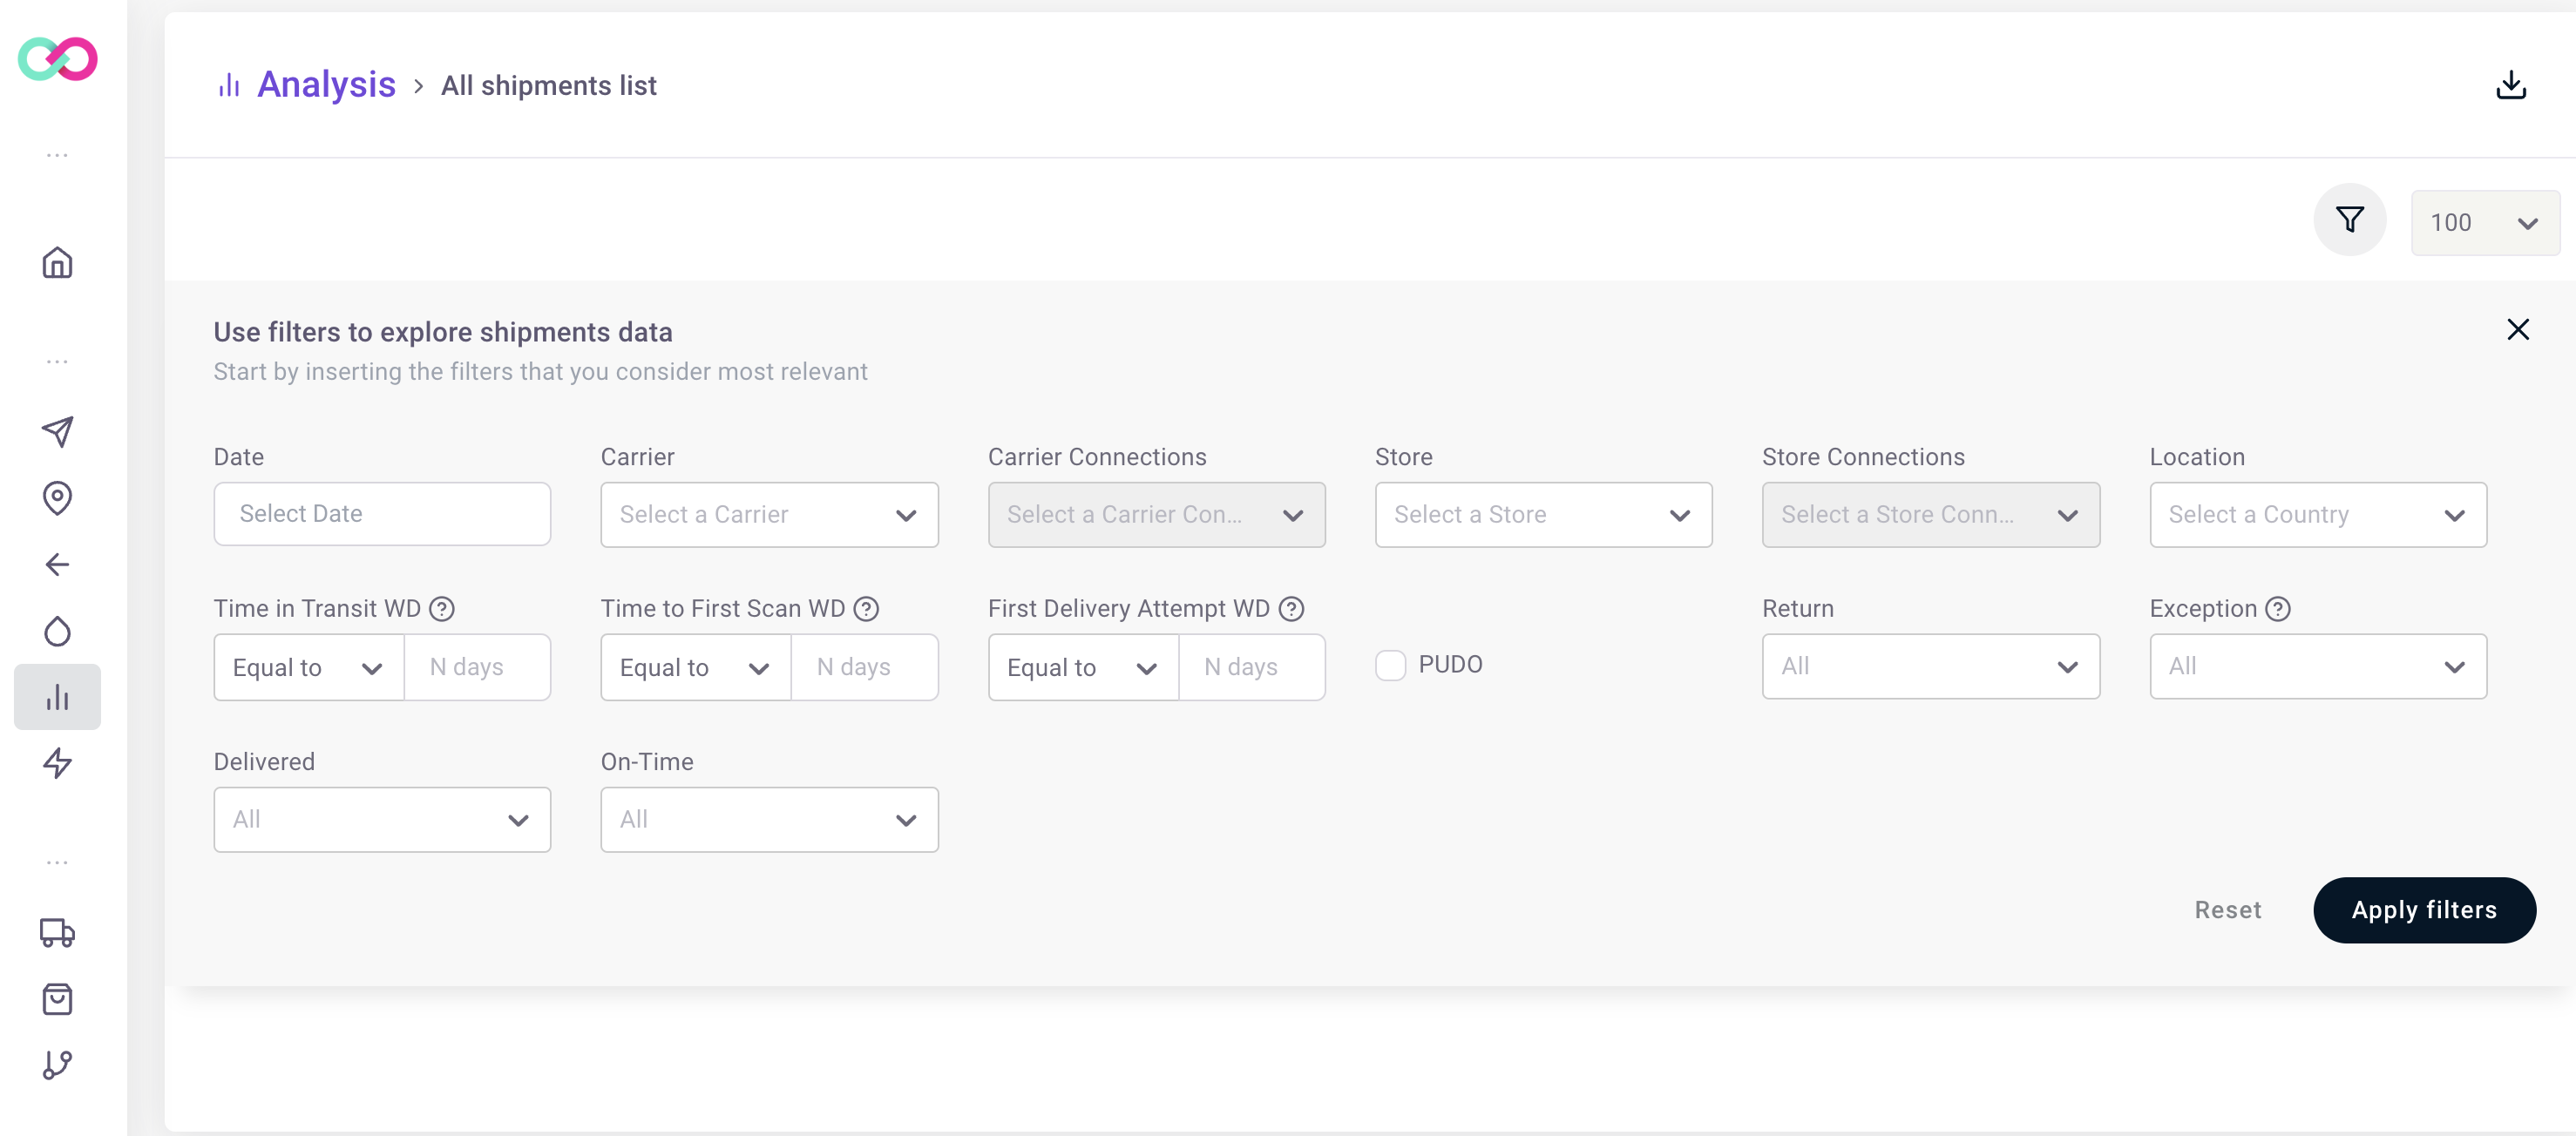
By applying filters you can visualize the information you need and download it.
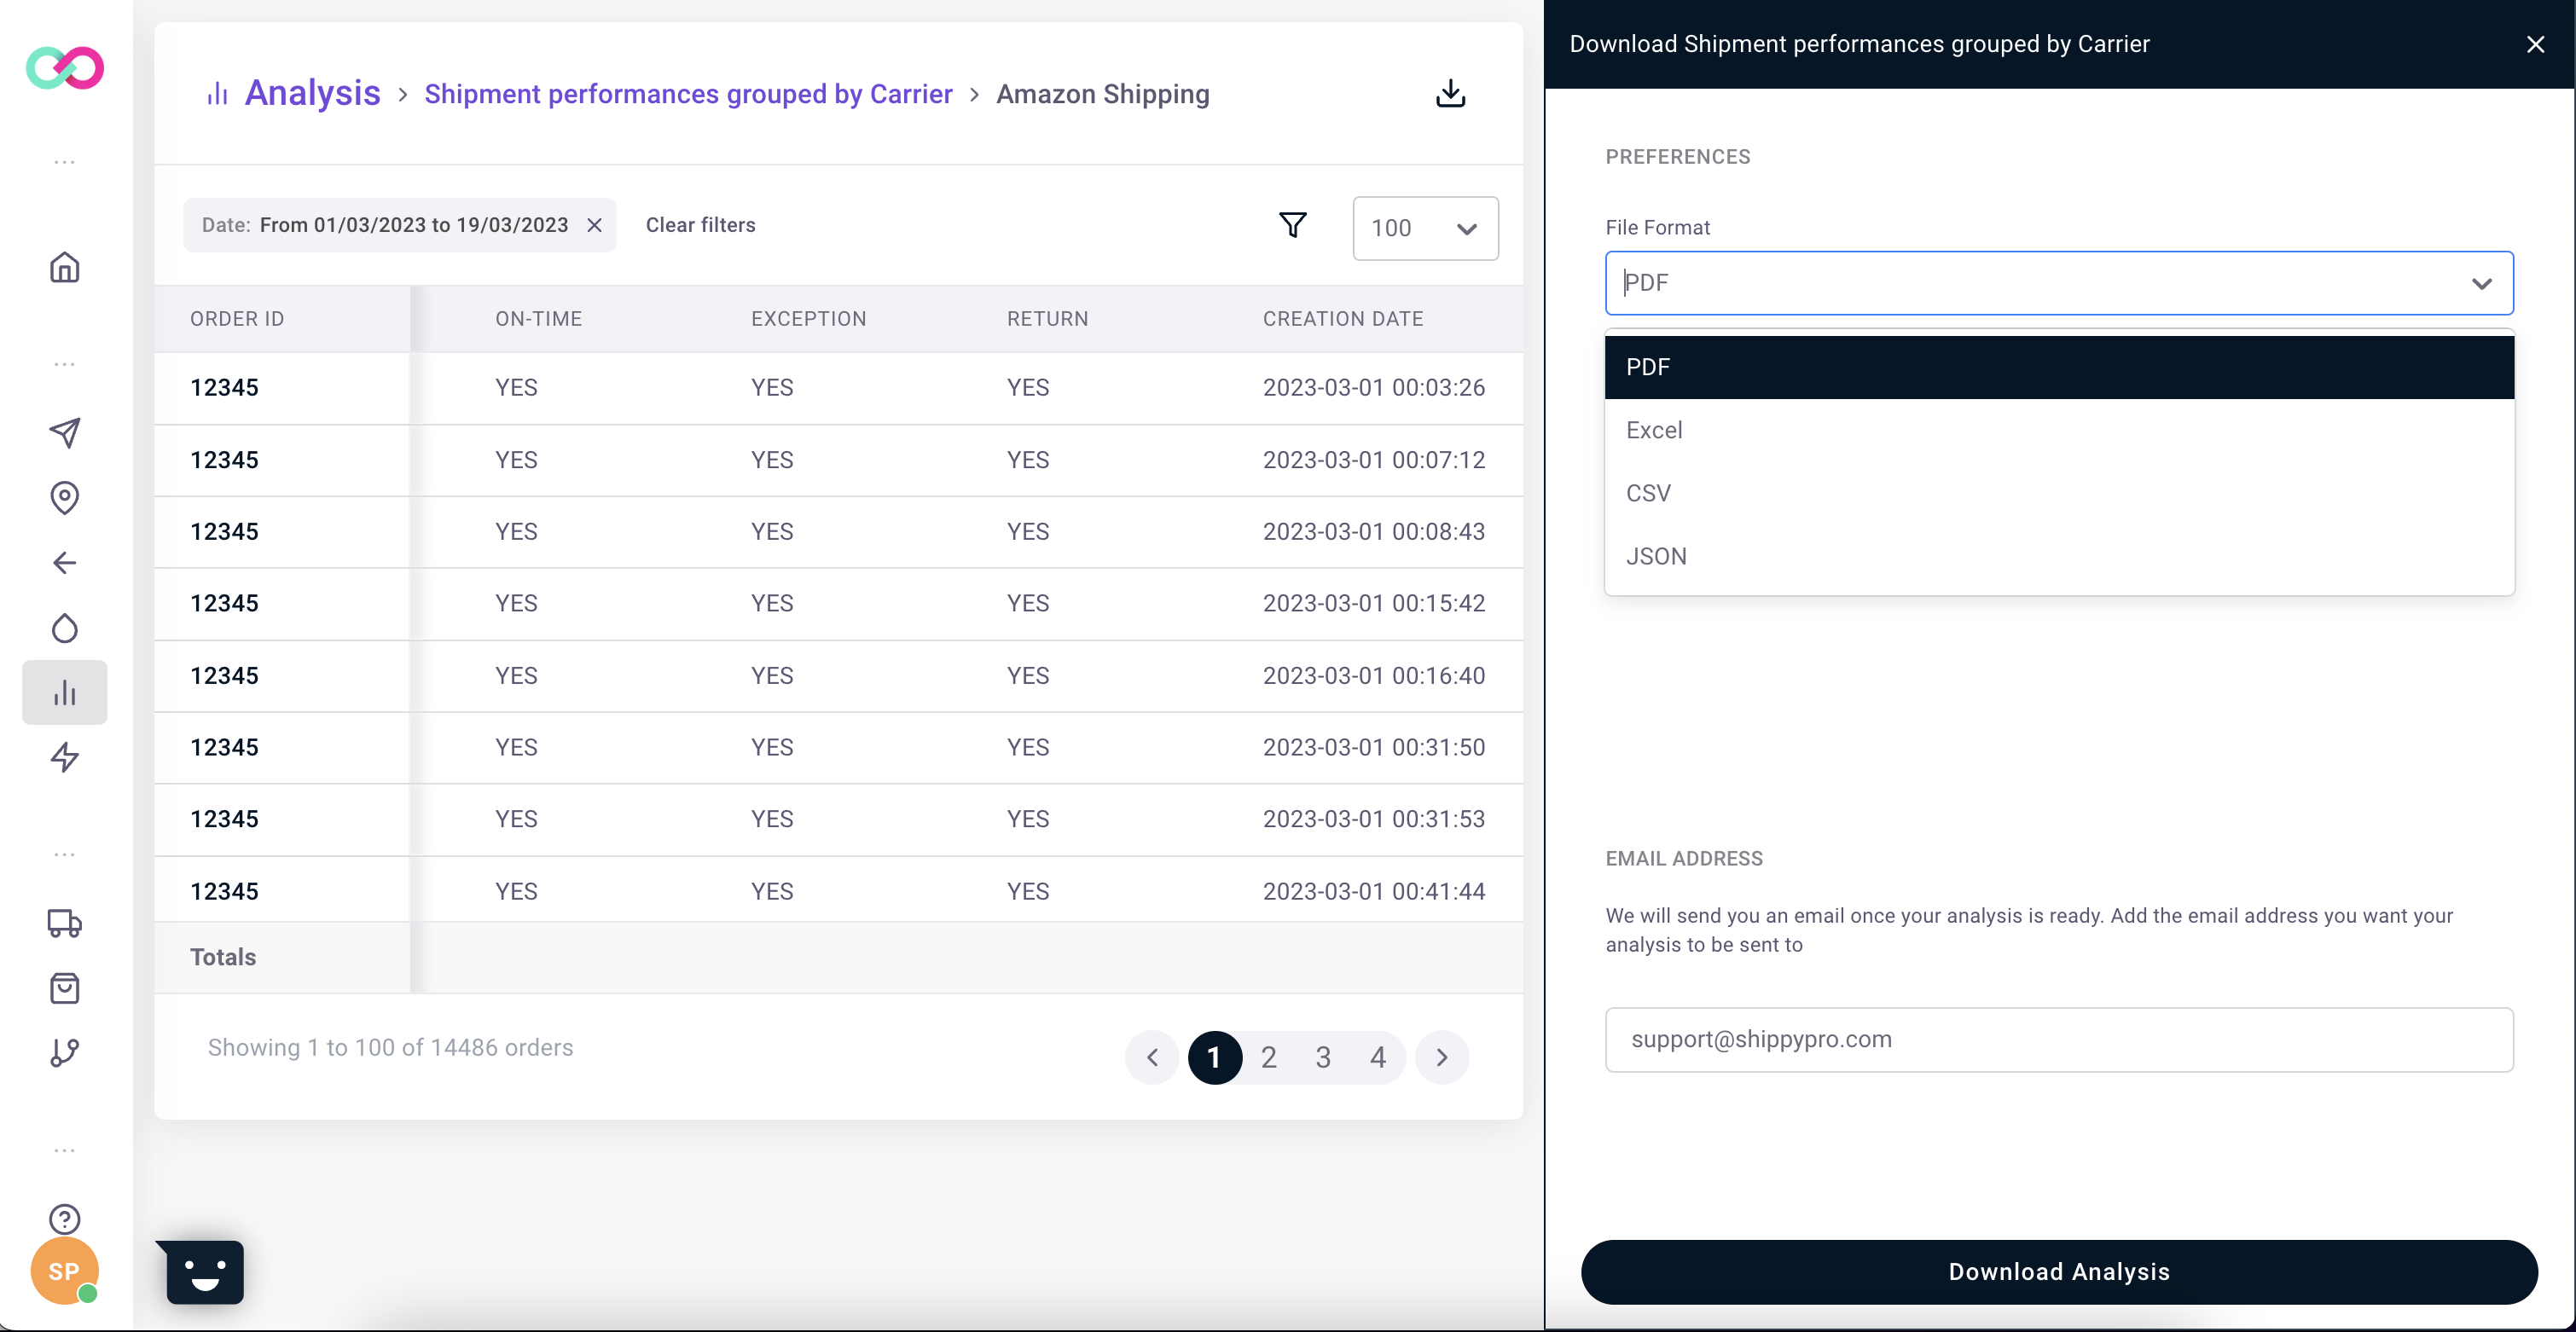
c. Download data
You can download detailed data analysis to share with your teams, or even use it to make further analysis, in the following format: pdf, excel, csv and json.
An email will be sent to your email inbox with the link to the file.
d. Data updates
Shipments status could change during the entire shipment life cycle. ShippyPro updates Shipment KPI on a daily basis and this means that some KPIs could vary during the shipment lifecycle.
3. How to activate Analytics
Each Analytics section (Shipment Performance, Revenue and Shipment Costs, Returns, etc.) should be activated by our Sales department.
Once this option is enabled, you'll be able to access to Analytics > Dashboard page and Analytics > Analysis page, otherwise a specific paywall will be displayed.
🔥 Ready to take your Shipment Analytics experience to a brand new level? Contact a member of our Sales Team to start getting business-critical KPIs and drive your business to the max.